Benchee 0.5.0 released - unit scaling for your convenience!
Another month and another release of my Elixir (micro-) benchmarking library benchee. This particular release focusses on unit scaling. E.g. instead of displaying that you had 12_345_678 iterations per second it will now say that there were 12.35 M iterations per second. The same goes for the time as well. There are four different strategies to choose from determining how units should be scaled. My friend and old Shoes (Ruby tooklkit/DSL for building GUIs) companion Eric Watson aka @wasnotrice did the bulk of the work. Thanks! As usual, the nitty-gritty details are in the Changelog.
Why unit scaling?
The units employed so far were not ideal. Who really works with microseconds all the time and like to read full numbers over a million while only the first couple of places really have an impact? I think it’s easier to work with units closer to what a number really is. If something takes 5_632 microseconds to execute I’m much better off knowing that it takes about 5.63 milliseconds. So from now on benchee will use one of its four strategies (one of which is none, if you don’t like this behaviour at all) to determine what the best unit to represent the benchmarking results in might be. For the canonical flat_map vs. map.flatten example the result might look like this:
Source: https://gist.github.com/pragtobgists/0e37be2494d80271f698e3469193ea51
File: benchmark.exs
list = Enum.to_list(1..10_000)
map_fun = fn(i) -> [i, i * i] end

Benchee.run(%{time: 3}, %{
  "flat_map"    => fn -> Enum.flat_map(list, map_fun) end,
  "map.flatten" => fn -> list |> Enum.map(map_fun) |> List.flatten end
})
File: result
tobi@happy ~/github/benchee $ mix run samples/run.exs
Erlang/OTP 19 [erts-8.1] [source-4cc2ce3] [64-bit] [smp:8:8] [async-threads:10] [hipe] [kernel-poll:false]
Elixir 1.3.4
Benchmark suite executing with the following configuration:
warmup: 2.0s
time: 3.0s
parallel: 1
Estimated total run time: 10.0s

Benchmarking flat_map...
Benchmarking map.flatten...

Name                  ips        average  deviation         median
map.flatten        1.26 K        0.80 ms    ±15.96%        0.75 ms
flat_map           0.86 K        1.17 ms     ±4.48%        1.18 ms

Comparison:
map.flatten        1.26 K
flat_map           0.86 K - 1.46x slower
See how the units were automatically scaled to thousands/milliseconds respectively? Now, you might not like that because you always want there to at least be a “1” before the dot. No problem, just use another scaling strategy: smallest!
Source: https://gist.github.com/pragtobgists/8e05c96083c8f53afa43cc7788da4d04
File: benchmark.exs
list = Enum.to_list(1..10_000)
map_fun = fn(i) -> [i, i * i] end

Benchee.run(%{time: 3, console: %{unit_scaling: :smallest}}, %{
  "flat_map"    => fn -> Enum.flat_map(list, map_fun) end,
  "map.flatten" => fn -> list |> Enum.map(map_fun) |> List.flatten end
})
File: result
tobi@happy ~/github/benchee $ mix run samples/run.exs
Erlang/OTP 19 [erts-8.1] [source-4cc2ce3] [64-bit] [smp:8:8] [async-threads:10] [hipe] [kernel-poll:false]
Elixir 1.3.4
Benchmark suite executing with the following configuration:
warmup: 2.0s
time: 3.0s
parallel: 1
Estimated total run time: 10.0s

Benchmarking flat_map...
Benchmarking map.flatten...

Name                  ips        average  deviation         median
map.flatten       1251.52      799.03 μs    ±15.45%      762.00 μs
flat_map           849.87     1176.65 μs     ±4.54%     1189.00 μs

Comparison:
map.flatten       1251.52
flat_map           849.87 - 1.47x slower
This is now (in this case) pretty much like the output you’d get in previous benchee versions. Still, smallest is different from none in that if both averages were at least a millisecond they would still be displayed in milliseconds. Under the hood this is all nicely handled by units (Count, Duration) implementing the Scale and Format behaviours while relying on a Unit struct.
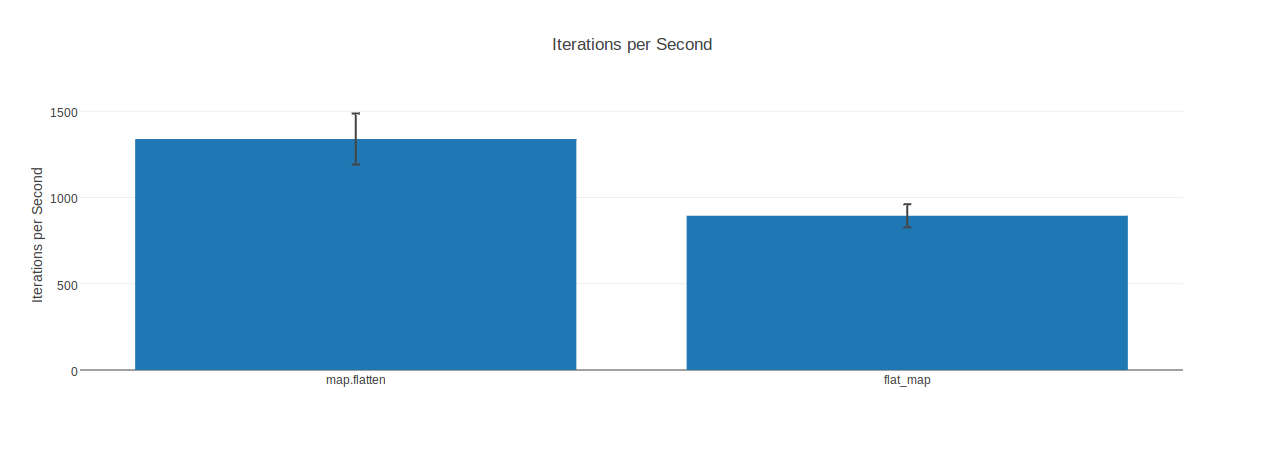
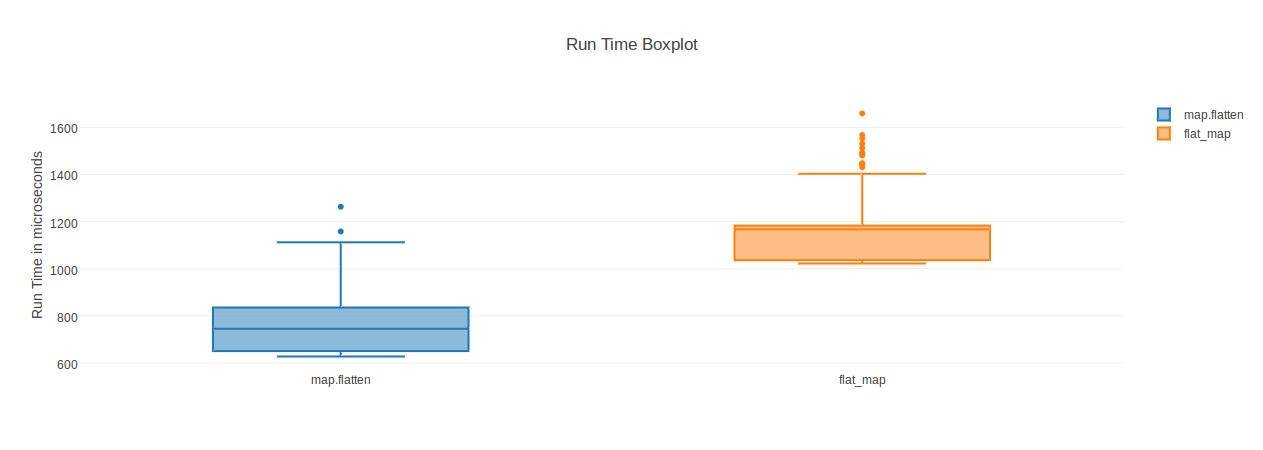
What’s next for benchee?
The next bigger topic that I’ve put quite some time and experiments in is an HTML formatter with fancy graphs and an image export. Want a sneak-peak? Ok, since you asked nicely: